Demographic Shifts Driving Casino Site Selections in Previously Underserved Rural Markets
Blake Vogel · Jul 21, 2026
Demographic Shifts Driving Casino Site Selections in Previously Underserved Rural Markets
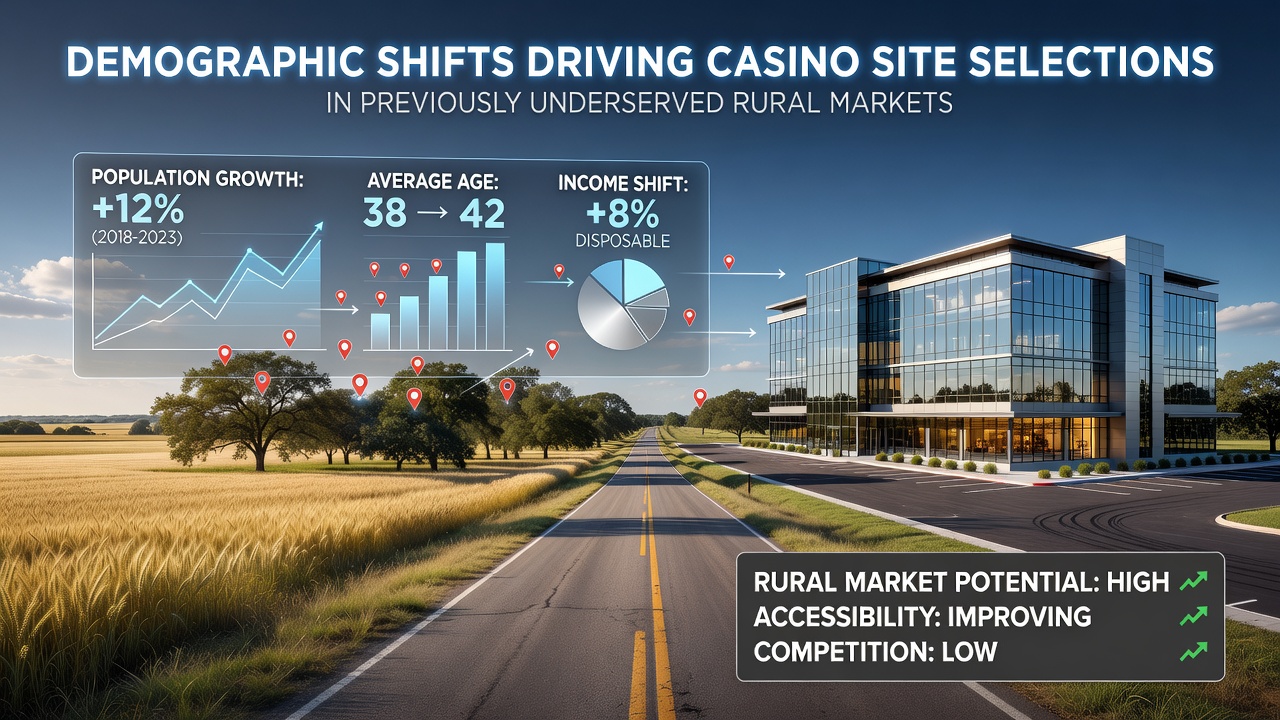
Population movements across the United States have altered the makeup of many rural counties since 2020, and operators have responded by selecting sites in communities that previously lacked gaming facilities. Census data shows net migration into nonmetropolitan areas increased by 0.8 percent between 2023 and 2025, driven by remote-work patterns and housing affordability, while birth rates in those same counties declined. These changes created pockets of middle-aged and older residents with disposable income who previously traveled long distances for entertainment options.
Population Aging and Income Patterns
Researchers tracking rural demographics note that the median age in counties with populations under 50,000 rose to 42.7 years by mid-2025, compared with 38.9 years in metropolitan areas. At the same time, household incomes in select agricultural and energy-producing regions climbed above national averages because of commodity prices and new manufacturing facilities. Gaming companies examined these statistics when evaluating markets that could support year-round visitation without relying solely on weekend travelers from distant cities. State regulatory filings from 2024 and 2025 list several applications that cited local population stability and rising per-capita spending on leisure as primary justification for new rural licenses.
Access and Infrastructure Improvements
Broadband expansion projects funded through federal legislation reached more than 1.2 million rural households by early 2026, and four-lane highway upgrades connected previously isolated towns to regional airports. These developments reduced travel barriers that once discouraged operators from considering remote locations. In July 2026, transportation departments in three Midwestern states reported completion of interchange improvements directly serving proposed casino parcels, shortening drive times from surrounding counties by an average of 35 minutes. Location analysts incorporated these infrastructure metrics into feasibility models alongside demographic projections.
Market Selection Criteria Used by Operators
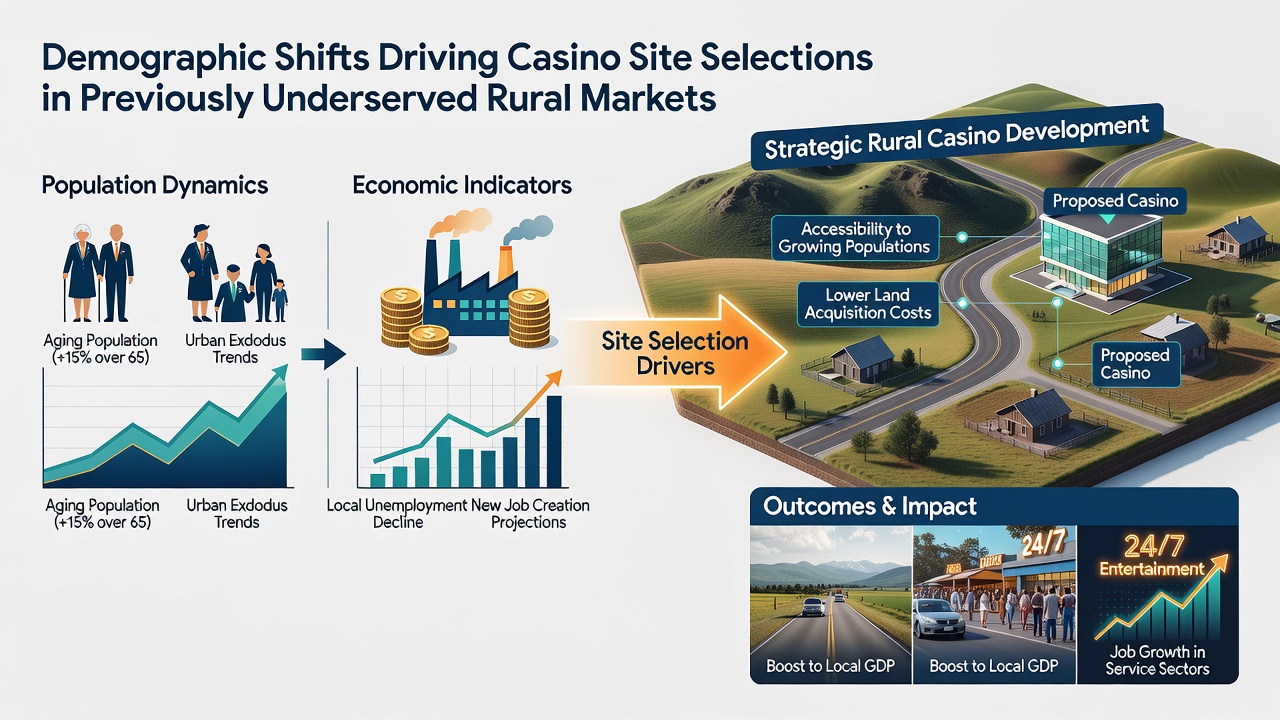
Developers now weigh drive-time radii that encompass both permanent residents and seasonal workers in agriculture and logistics. Reports submitted to gaming control boards show that companies calculate expected daily visitation using zip-code level data on age cohorts between 45 and 70, combined with vehicle-registration counts. One project approved in a Plains state used a 90-mile radius containing 187,000 adults whose average household income exceeded $68,000. Similar calculations appear in applications filed for sites in the Southeast, where population growth in exurban zones outpaced urban cores between 2021 and 2025. These quantitative approaches replaced earlier reliance on proximity to major tourist corridors.
Regulatory and Tribal Considerations
State legislatures adjusted licensing frameworks to accommodate smaller-scale facilities suited to lower population densities. Amendments passed in 2025 in two states lowered minimum capital requirements for rural properties while maintaining responsible-gaming standards. Tribal nations also expanded gaming footprints onto trust land located near growing rural population centers, citing demographic studies that showed increased demand within reservation boundaries and adjacent counties. Coordination between state and tribal regulators produced joint marketing guidelines that reference the same census tract information used by commercial applicants.
Economic Indicators and Visitation Data
Figures released by state revenue departments indicate that rural casinos opened between 2022 and 2024 recorded average win per position 12 percent higher than urban properties of similar size during their first full year of operation. Analysts attribute part of this outcome to longer average session lengths among local patrons who face fewer competing entertainment options. Employment data collected by workforce agencies show these facilities hired 65 percent of staff from within a 30-mile radius, aligning with demographic goals of retaining working-age residents. US Census Bureau visualizations map the counties where these employment and visitation patterns overlap with documented population gains.
Comparative Regional Examples
Counties in the northern Rockies that gained residents through energy-sector expansion approved three new limited-stakes facilities in 2025 after local referendums passed by margins exceeding 55 percent. In the upper Midwest, two counties experiencing return migration of retirees authorized satellite casinos attached to existing racetracks, using demographic profiles that projected steady weekday traffic from nearby towns. Canadian provincial regulators approved a similar rural expansion in 2026, citing parallel aging trends documented by Statistics Canada population reports. Each case relied on the same core data sets: age distribution, household formation rates, and commuting patterns.
Conclusion
Demographic records compiled through 2026 demonstrate that sustained population growth, combined with infrastructure upgrades and refined site-selection models, has shifted gaming development toward previously overlooked rural markets. Regulatory approvals and revenue figures confirm that operators continue to apply these metrics when evaluating new locations. The pattern reflects measurable changes in where people live and work rather than speculative forecasts.